The typical Oxford home was worth $407,120 in October, up 1.7% in a year, Zillow says. That is the smallest yearly rise since 2019, and values have dipped since August.
Oxford home values grew at their slowest pace in seven years over the 12 months to October.
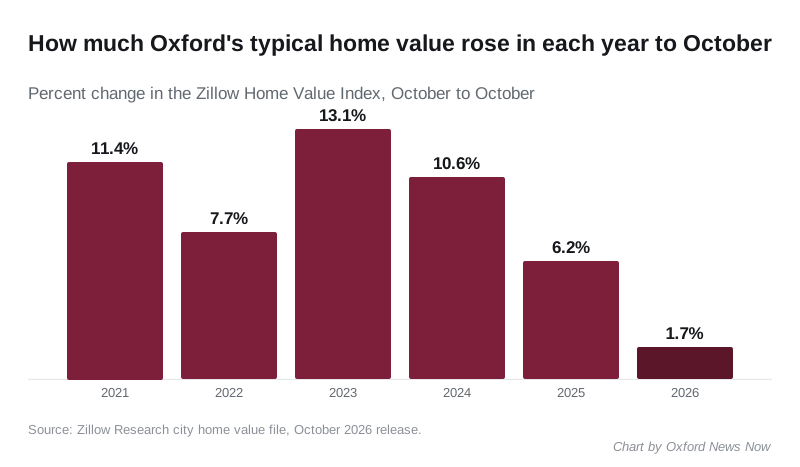
The typical Oxford home was worth $407,120 in October, according to the Zillow Home Value Index. That is up 1.7% from $400,165 in October 2025. It is the smallest October-to-October rise since 2019, when the index fell 1%.
The figures are in the city home value file Zillow Research published Monday.
Two months of small dips
Oxford’s index peaked at $409,212 in August. It slipped to $408,773 in September and to $407,120 in October. October’s figure is the lowest since February.
The drops are small, about half a percent in all since August. But they follow five years of fast growth. The typical Oxford home was worth $250,806 in October 2020, so values are still about 62% higher than six years ago.
Zillow’s yearly rise to each October:
- 2021: 11.4%
- 2022: 7.7%
- 2023: 13.1%
- 2024: 10.6%
- 2025: 6.2%
- 2026: 1.7%
The index is a modeled value for homes in the middle third of the market, smoothed and seasonally adjusted. It is not a sale price, and Zillow revises past months with every release. This month’s file lowered Oxford’s September figure to $408,773, from the $415,283 Zillow published in October.
Still second in Mississippi
Oxford remains the second-most expensive of the 336 Mississippi cities in Zillow’s index. Only Madison, near Jackson, is higher, at $410,006. Taylor, about six miles south of Oxford, is third at $384,586.
The typical Oxford home is worth more than twice the Mississippi figure of $192,138. Statewide, values rose 2% in a year. Lafayette County as a whole was at $395,851, up 1.9%.
Nearby towns moved at different speeds. Distances are straight-line from central Oxford:
| Town | Typical value, October 2026 | Change in a year |
|---|---|---|
| Oxford | $407,120 | +1.7% |
| Taylor, about six miles south | $384,586 | +1.3% |
| Abbeville, about 11 miles north | $238,070 | +0.2% |
| Water Valley, about 14 miles south | $174,586 | +2.6% |
| Batesville, about 22 miles west | $191,782 | +3.4% |
| Holly Springs, about 30 miles north | $174,370 | -3.8% |
| New Albany, about 31 miles northeast | $199,308 | +7.4% |
| Pontotoc, about 31 miles east | $208,602 | +6.4% |
| Tupelo, about 46 miles east | $213,560 | +5.4% |
The biggest gains were in the towns to the east, where homes cost about half as much as in Oxford.
Sales and rents
Zillow’s median sale price for Oxford was $387,500 in September, the latest month in that file. It was the lowest monthly figure in a year; over the previous 12 months it ranged up to $459,000. In a market Oxford’s size, that figure swings with the handful of homes that close each month.
Rents are still climbing. Zillow’s typical asking rent in Oxford was $2,611 in October, up 3.7% from $2,519 a year earlier. That is the highest of the 32 Mississippi cities in Zillow’s rent index.
Builders are still adding homes. The Census Bureau’s Building Permits Survey shows Oxford authorized 23 housing units in September, 18 of them single-family homes, with a construction value of $7,533,168.
What it means for you
- Buying: prices have stopped climbing for now, but the typical Oxford home still costs more than twice the state figure.
- Selling: expect a market that is roughly flat on last year, not the double-digit gains of 2021 to 2024.
- Checking your own home: Mississippi does not require sale prices on deeds, so there is no public sales database. Your property tax bill is based on the Lafayette County Tax Assessor’s appraisal, not Zillow. Our Oxford home prices page has every measure and who to call.
- Renting: asking rents are still rising faster than home values.
Sources: Zillow Research city, county and state home value files, city median sale price file and city rent index (October 2026 release); U.S. Census Bureau Building Permits Survey (September 2026); straight-line distances from Census Bureau 2023 place centroids.
Have your say